When an FBLA market segmentation prompt asks you to “choose a customer group,” the judges are not testing whether you can name a demographic. They are testing whether you can select a segment that your proposed product or service can actually reach, serve, and profit from—and whether your evidence for that choice is stronger than the evidence for the groups you rejected. This article works through the decision mechanism, shows a checked example and a contrasting failure, and gives you a short diagnostic you can apply to any segmentation task.
What “Choose a Customer Group With Evidence” Actually Means in FBLA
In FBLA competitive events, market segmentation appears in several formats: objective tests with scenario-based multiple choice, case studies with written analysis, and presentation events where you build and defend a segmentation strategy. Across all formats, the same principle applies: a valid segment must be measurable, accessible, substantial, and actionable. The evidence requirement means you must show why your chosen group meets these criteria and why alternatives fall short.
The IMA teaching observation on FBLA preparation emphasizes that students often conflate “describing a customer” with “segmenting a market.” Describing a customer means listing traits: age, income, location. Segmenting a market means identifying a group whose needs are sufficiently distinct that a tailored offering creates more value than a mass-market approach—and whose size and reachability justify the tailoring cost. This distinction is where evidence becomes decisive.
The Selection Mechanism: Four Filters Applied in Sequence
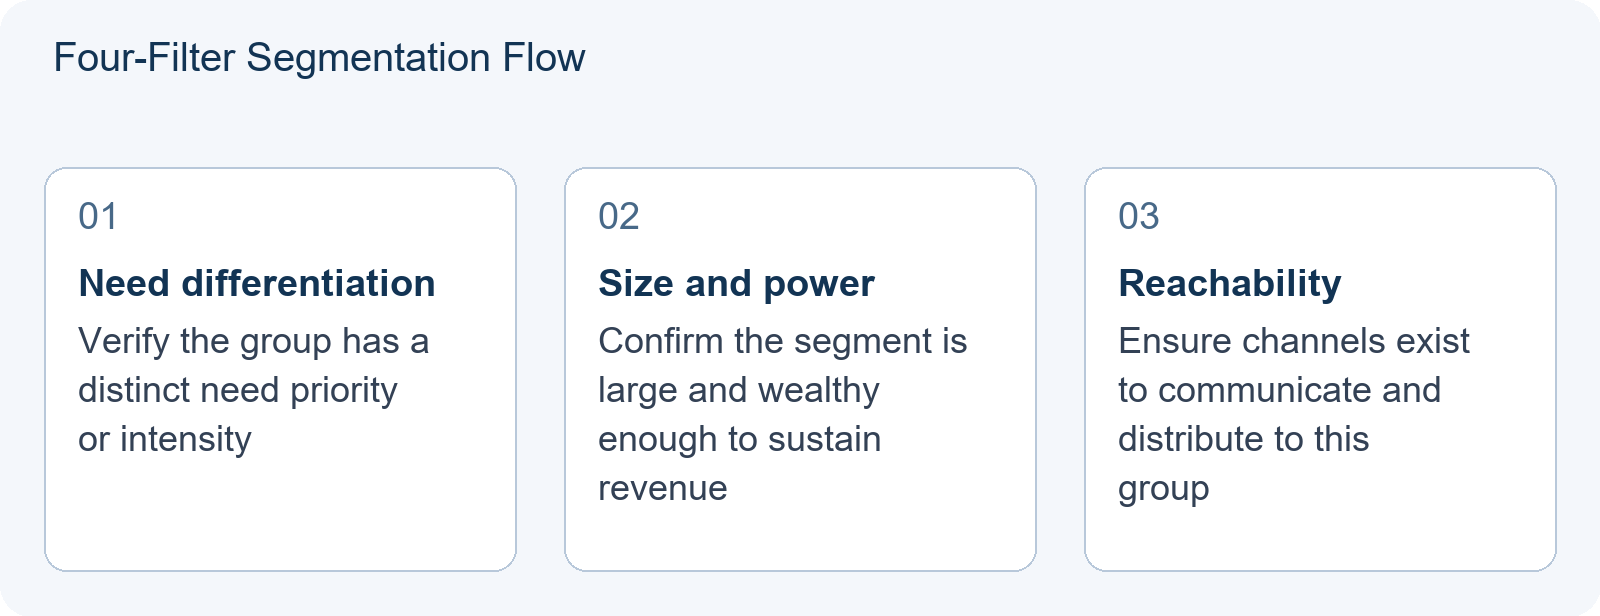
A rigorous segmentation choice moves through four filters. Skipping any filter produces weak evidence that judges penalize. These filters are an optional teaching tool for structuring analysis, not official FBLA rules or validated scoring thresholds.
Filter 1: Need-based differentiation. Does the group have a need that differs meaningfully from other groups? Evidence: survey data, purchase-pattern analysis, or documented pain points. Not evidence: “young people like technology” without showing how their tech needs differ from other age groups. Note: needs can overlap across groups; a segment is not invalid merely because its members share some needs with other backgrounds. Differentiation requires a distinct priority or intensity of need, not completely exclusive needs.
Filter 2: Size and purchasing power. Is the group large enough and wealthy enough to sustain the business? Evidence: market size estimates, income distributions, or spending data. Not evidence: assuming a group is “big” without quantification.
Filter 3: Reachability. Can the business actually communicate with and distribute to this group? Evidence: channel availability, media consumption data, or partnership access. Not evidence: claiming you will use “social media” without specifying which platforms this group uses and how you will target them.
Filter 4: Competitive vulnerability. Is this group underserved by current competitors? Evidence: competitor gap analysis, customer switching-cost assessment, or satisfaction surveys. Not evidence: stating competitors are “bad” without showing why your group specifically is neglected.
A valid segment must pass all four filters. A group that passes three but fails one is not a segment you should choose, no matter how appealing it seems.
Worked Teaching Illustration: The Campus Coffee Subscription
The following scenario is a teaching illustration developed for practice. All figures are hypothetical assumptions for educational purposes, not claims about any real university.
Consider this scenario: A startup proposes a subscription service delivering freshly roasted coffee to university students. The team must choose one primary segment from three candidates: (A) all students at a university, (B) students who purchase coffee three or more times per week (high-frequency purchasers), or (C) students who purchase single-origin specialty coffee at least twice monthly (premium purchasers).
Step 1: Apply Filter 1 to all candidates.
Group A (all students): Needs vary wildly—some want cheap caffeine, others want artisanal experience. Need differentiation is low; this is a mass market masquerading as a segment. Filter 1 fails.
Group B (high-frequency purchasers): Regular consumption creates sustained demand; delivery timing matters for this group in ways it does not for occasional purchasers. Need is differentiated from general student population. Filter 1 passes.
Group C (premium purchasers): Strong preference for specific origins and higher willingness to pay for quality—but also may have established supplier relationships or price sensitivity that offsets premium willingness. Need differentiation is plausible but unverified; evidence is mixed. Filter 1 conditionally passes pending data.
Step 2: Apply Filter 2 (size and purchasing power).
Group B: At a university with 8,000 students, assume 40% purchase coffee three or more times weekly—that is 3,200 students. Assumption: disposable income for convenience goods is constrained; this is an hypothetical illustration pending real survey data. At 100% adoption, revenue potential is 3,200 students × $15/month × 8 months = $384,000 annually. However, 100% adoption is an upper bound, not a forecast. At 10% adoption (320 students), annual revenue is 320 × $15 × 8 = $38,400. Filter 2 passes with modest but calculable size, contingent on adoption rate and cost structure.
Group C: Premium purchasers might be 5% of students; at 8,000 students, that is 400 students. Even with higher willingness to pay ($25/month), at 10% adoption annual revenue is 40 × $25 × 8 = $8,000. Filter 2 may fail depending on cost requirements; revenue alone does not determine viability without comparing costs.
Step 3: Apply Filter 3 (reachability).
Group B: High-frequency purchasers can be reached through campus dining partnerships, student union advertising, and class-break delivery locations. Assumption: channel access pending university consent, not guaranteed. Filter 3 passes conditionally.
Group C: No existing channel reliably reaches only premium purchasers. Specialty advertising risks broad waste. Filter 3 fails.
Step 4: Apply Filter 4 (competitive vulnerability).
Group B: Existing campus cafes serve all students generically; none optimize for frequent-purchaser convenience with scheduled delivery. A subscription with predictable delivery fills a gap. Filter 4 passes.
Conclusion: Group B is the only segment that passes all four filters. The evidence supports choosing high-frequency purchasers. Group A fails differentiation; Group C fails reachability and has uncertain size. This is the kind of step-by-step elimination judges reward.
Contrasting Case: Where Superficial Similarity Leads to Failure
Now consider a superficially similar scenario that fails: the same coffee subscription, but the team chooses “busy students who value convenience.”
This sounds like Group B (frequent purchasers are busy and value convenience), but it is not a segment—it is a need statement without boundaries. Let us check why this choice collapses under the same four filters.
Filter 1 re-check: “Busy students who value convenience” includes medical students, law students, student-athletes, and working parents. Their needs differ: some need sustained energy through long shifts; others need pre-workout timing; others need family-sized options. The supposed segment contains multiple incompatible needs. Filter 1 fails more severely than Group A above, because it pretends to be differentiated while actually being heterogeneous.
Filter 2 re-check: Size is impossible to determine because the group is undefined. Is it 10% of students? 50%? Without boundaries, revenue projections are arbitrary. Filter 2 fails.
Filter 3 re-check: Reachability fragments: medical students are at hospitals, athletes at training facilities, working parents off-campus. No single channel serves all. Filter 3 fails.
Filter 4 re-check: Competitive vulnerability is incoherent—some sub-groups are well-served (hospital cafes for medical students), others are not. Filter 4 fails.
The lesson: a segment description that uses adjectives instead of boundaries produces uncheckable claims. “Busy” and “values convenience” are not segmentation variables; they are aspirations. The contrasting case shows that even when the product is identical, the segment choice determines whether the strategy is defensible.
Diagnostic Application: The Segment-Choice Scorecard
This scorecard is an optional teaching tool for self-assessment, not an official FBLA scoring instrument.
Use this scorecard for any FBLA segmentation task. Rate your proposed segment 0–3 on each criterion, with evidence required for non-zero scores.
| Criterion | Score 0 | Score 1 | Score 2 | Score 3 |
|---|---|---|---|---|
| Need differentiation | No distinct need vs. general market | Different need stated, unverified | Different need supported by qualitative data | Different need quantified with primary or secondary research |
| Size/purchasing power | No estimate provided | Rough guess with no source | Reasonable estimate with cited source | Calculated from verified data with revenue projection |
| Reachability | No channel identified | Channel named, no access proof | Channel accessible with described method | Channel tested or contracted with evidence |
| Competitive vulnerability | No competitor analysis | Competitors named, no gap shown | Specific gap identified with customer evidence | Gap quantified with switching-cost or satisfaction data |
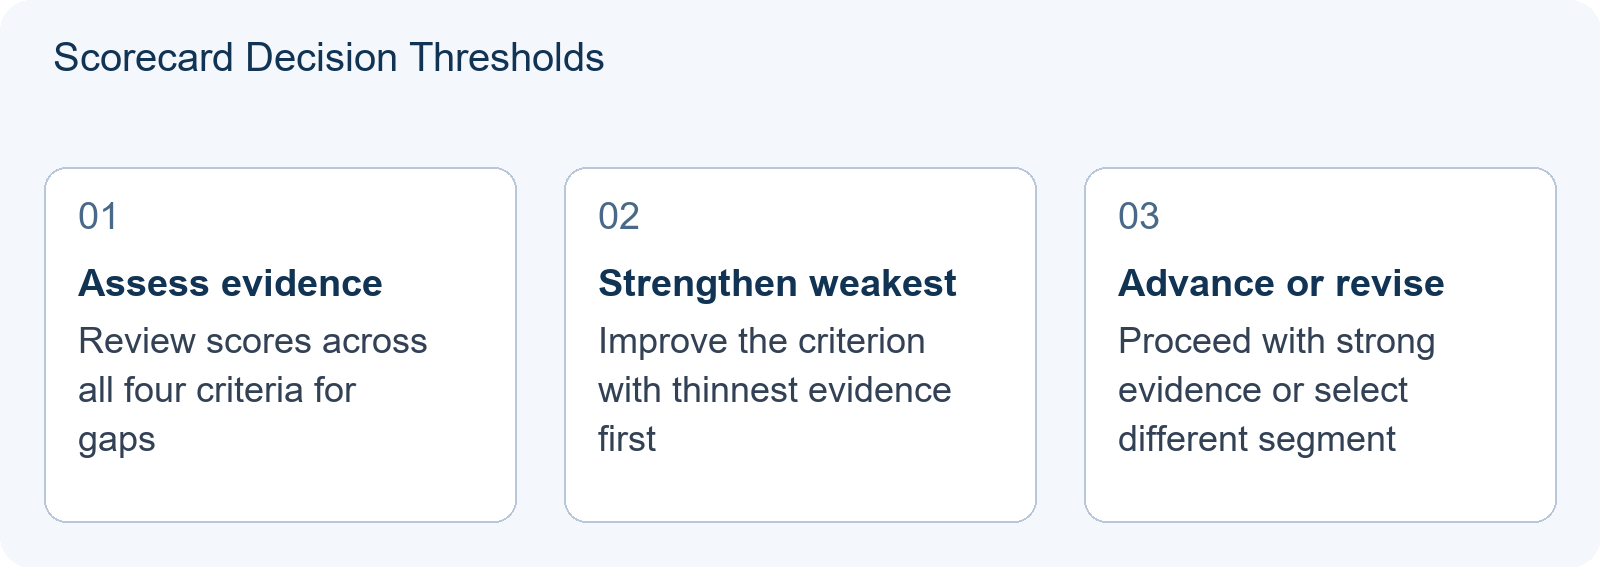
A segment with strong evidence across all criteria should be advanced; thin evidence suggests gathering more data before finalizing. In the worked illustration above, Group B scores 2+2+2+2 = 8, indicating defensible but improvable evidence. Group C scores 1+1+0+1 = 3, with critical gaps in reachability. The failed contrasting case scores 0+0+0+0 = 0. These ranges are advisory, not mandatory thresholds.
What Your Score Means for Next Steps
If your segment shows thin evidence across criteria: Strengthen one criterion with additional research before finalizing your presentation or written response. Priority: move the weakest criterion up one level.
If your segment shows strong evidence: Focus your preparation on communicating the elimination of alternatives clearly—judges want to see not just why your segment works, but why others were rejected.
If your segment shows critical gaps: Consider gathering substantially better evidence or selecting a different group. In timed competition conditions, selecting a weaker segment with better evidence often outperforms selecting an intuitively appealing segment with weak evidence.
The IMA teaching observation notes that students in China preparing for FBLA often select segments based on personal familiarity rather than evidence strength. This diagnostic is designed to counter that tendency by making evidence quality visible and comparable.
Connecting to Related FBLA Skills
Market segmentation does not exist in isolation. The evidence-gathering skills overlap directly with FBLA Survey Design: Turning Customer Opinions Into Usable Business Evidence, which covers how to structure questions that produce measurable segmentation data. The assumption-testing discipline connects to FBLA Case Study Assumptions: Separating Evidence From a Convenient Guess, particularly the habit of distinguishing what you believe from what you can demonstrate. For financial validation of segment size, see FBLA Break-Even Analysis: Explaining Fixed Costs, Margins and Uncertain Demand, which shows how to project whether a segment can sustain the fixed costs of serving it.
These three articles together form a preparation cluster: survey design produces data, segmentation analysis organizes that data into decisions, and break-even analysis validates the financial viability of those decisions.
Next Step: Gather Evidence Before You Commit
Before finalizing any segment choice, collect the following: the exact prompt or scenario you are responding to; any data provided in the prompt (market sizes, competitor descriptions, customer quotes); your initial segment candidate and your evidence for each of the four filters; and one alternative segment you rejected and why. Having this material ready allows focused analysis on strengthening evidence rather than rediscovering basics.
Frequently Asked Questions
Can I choose a segment based on intuition if I lack survey data?
In competition conditions, you must work with the data provided in the prompt. If no primary data is given, use logical inference from stated facts and explicitly note where evidence is limited. Intuition without any supporting reasoning receives low scores because it cannot be verified.
How many segments should I present in a written case study?
Present one primary segment with full evidence. You may briefly mention 1–2 rejected alternatives to show rigorous selection, but depth on one segment outperforms shallow coverage of multiple segments.
Does the four-filter method apply to all FBLA events with segmentation?
Yes, the underlying logic applies across objective tests, case studies, and presentations. The format of evidence presentation varies—multiple choice requires recognition, while presentations require defense—but the criteria for valid segmentation remain consistent.