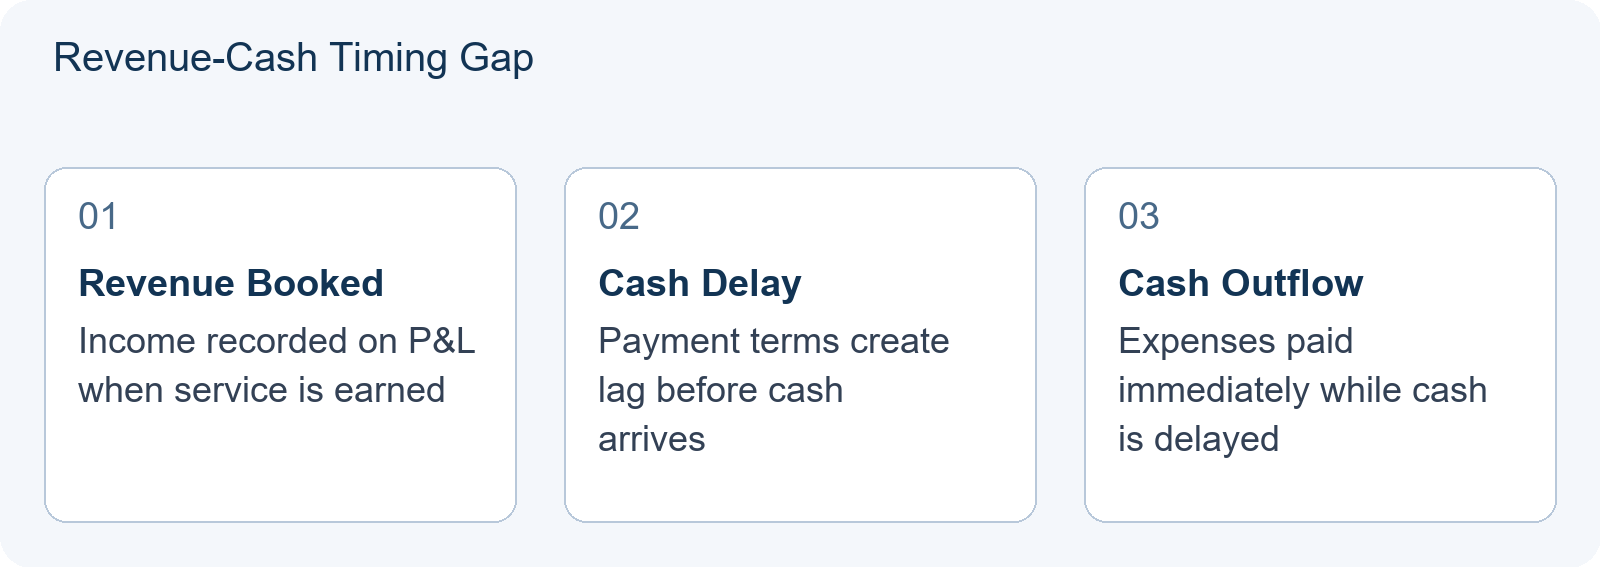
For many FBLA students preparing for business case studies or objective tests, a common point of confusion is how a company can report a healthy net income on its income statement yet still face operational failure. The answer lies in FBLA Cash Flow Analysis: understanding that profit is an accounting concept based on accruals, while cash flow is the physical reality of money moving in and out of the bank account. A profitable business runs out of cash when the timing of revenue recognition does not match the timing of actual cash collection, or when cash outflows for operations exceed inflows despite positive earnings. Importantly, a liquidity shortage is not identical to insolvency or bankruptcy; these terms describe different stages of financial distress, and this article does not provide legal definitions.
The Core Mechanism: Accrual vs. Cash Reality
In standard accounting (GAAP), revenue is recognized when earned, not necessarily when received. Expenses are matched to the period they help generate revenue, not when paid. This creates a gap between the Income Statement and the Balance Sheet. For FBLA competitions, particularly those involving financial analysis or entrepreneurship, judges look for the ability to identify this gap. If a student claims a business is “safe” because it has a high profit margin, they have failed the basic test of liquidity analysis. The mechanism of failure is simple: you cannot pay suppliers, employees, or lenders with accounts receivable; you must pay them with cash.
Worked Teaching Illustration: The Rapid Growth Trap
Note: This is a hypothetical teaching illustration designed to demonstrate the concept. It is not a real contest problem or official scoring guidance.
Consider “TechStart,” a fictional software company. In Q1, TechStart signs a contract for $100,000 worth of services delivered over three months. They recognize $33,333 in revenue each month (services earned). Their costs are $10,000 per month in salaries and server fees, paid immediately in cash. Taxes and other costs are ignored for clarity.
- Month 1: Revenue Recognized: $33,333. Cash Received: $0 (Client pays at end of quarter). Cash Paid: $10,000. Net Income: +$23,333. Cash Balance Change: -$10,000.
- Month 2: Revenue Recognized: $33,333. Cash Received: $0. Cash Paid: $10,000. Net Income: +$23,333. Cash Balance Change: -$10,000.
- Month 3: Revenue Recognized: $33,334. Cash Received: $100,000. Cash Paid: $10,000. Net Income: +$23,334. Cash Balance Change: +$90,000.
TechStart is highly profitable ($70,000 net income for the quarter: $23,333 + $23,333 + $23,334 = $70,000). However, if TechStart started with only $15,000 in cash, they face a financing shortfall by the end of Month 2. After Month 1: $15,000 − $10,000 = $5,000. After Month 2: $5,000 − $10,000 = −$5,000. The negative cash balance of $5,000 is not spendable cash; it represents a financing shortfall that must be covered by bridge funding, equity injection, or delayed payments. Without such bridge funding, operations halt in Month 2 despite profitability. If bridge funding of $5,000 is secured at the start of Month 2 and repaid from the Month 3 collection, ending cash after Month 3 equals $85,000 ($15,000 − $10,000 − $10,000 + $100,000 − $10,000 − $5,000 repayment + $5,000 bridge = $85,000). The $85,000 ending cash is shown only if bridge funding and repayment are handled explicitly.
Contrasting Case: Where Superficial Analysis Fails
A superficial approach might look at the Profit & Loss (P&L) statement alone. A student might argue, “The business has $70,000 quarterly profit, so it is financially strong.” This fails because it ignores working capital cycles. Contrast this with a correct analysis using the Statement of Cash Flows. Here, we see operating cash flow was negative for two months. The error in reasoning is assuming that economic value creation equals immediate liquidity. For a practice business analysis, this distinction helps explain whether the proposed operations can be financed.
However, growth does not always consume cash first. Consider a counterexample: if TechStart had required full prepayment before delivering services, cash would have been collected in Month 1 ($100,000), creating positive cash flow from the start despite identical revenue recognition. Prepayments, subscription models, and negative working capital businesses (like retailers who collect cash before paying suppliers) can grow without the same cash consumption pattern. The correct insight is that growth often consumes cash first, but not universally.
Diagnostic Application: Identifying the Gap
To prepare for FBLA questions, use this diagnostic framework. Given a set of financial data, ask three questions:
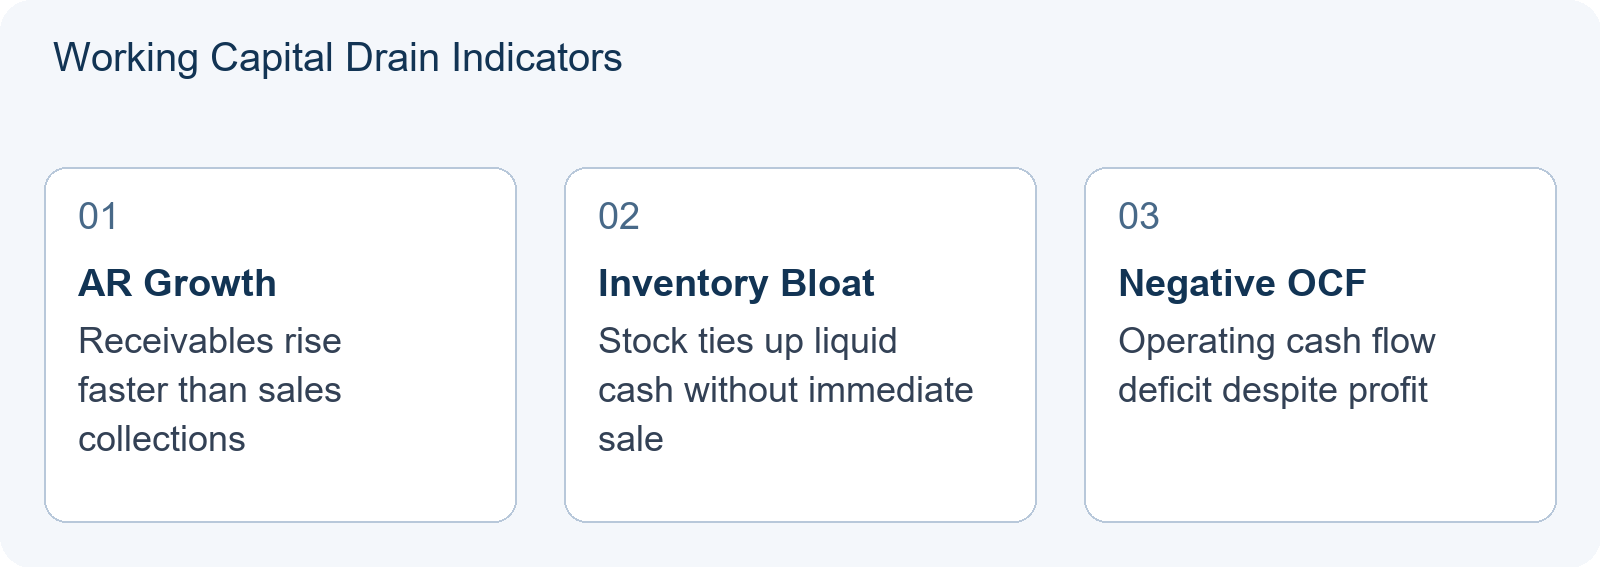
- Is Accounts Receivable growing faster than Sales? If yes, you are collecting cash slower than you are booking revenue. This drains cash.
- Are Inventory levels rising without corresponding sales increases? Buying stock uses cash. If it sits unsold, it is trapped cash.
- Are Capital Expenditures (CapEx) funded by internal cash or external financing? Large equipment purchases reduce cash balances immediately, regardless of depreciation schedules used in profit calculations.
If any of these answers are “yes,” the business is at risk of running out of cash despite profitability. Students should practice calculating the “Cash Conversion Cycle” to quantify this risk.
Implications for Learning and Feedback
Understanding this distinction changes how you study for FBLA objective tests. Instead of memorizing definitions of “Net Income,” focus on the relationships between the three financial statements. When receiving feedback from coaches or judges, look for comments on “liquidity,” “working capital,” or “cash burn rate.” These indicate areas where your analysis lacked depth. Useful feedback will ask, “How did you ensure the business could meet its short-term obligations?” rather than just “What was the profit?”
Relevant Resources and Further Reading
This topic intersects with several other key FBLA preparation areas. For students analyzing fixed costs versus variable costs in relation to cash flow, refer to our guide on FBLA Break-Even Analysis: Explaining Fixed Costs, Margins and Uncertain Demand. Understanding how demand uncertainty impacts cash reserves is crucial. Additionally, when presenting these findings in judged events, clarity is key; see FBLA Presentation Coaching: Choosing Feedback on Delivery, Slides and Questions for tips on explaining complex financial concepts simply. Finally, for those building evidence-based arguments about market conditions affecting cash flow, review FBLA Survey Design: Turning Customer Opinions Into Usable Business Evidence.
Interpreting the Gap: From Numbers to Narrative
The previous illustration of “TechStart” demonstrates a critical skill for FBLA case studies: translating raw financial data into a coherent operational narrative. Students often struggle not with the arithmetic, but with the interpretation. When judges review a feasibility analysis, they look for the ability to explain why a discrepancy exists and how it impacts strategic decision-making. A profitable company with negative operating cash flow is not necessarily failing; it may be executing a specific growth strategy that requires temporary liquidity sacrifice. The key is identifying whether this sacrifice is intentional and manageable.
Consider the diagnostic framework applied to TechStart’s Month 1 and Month 2 data. The net income was positive ($23,333), yet the cash balance dropped from $15,000 to $5,000, then to a financing shortfall of $5,000. This divergence signals a working capital strain driven by delayed collections. In a real-world scenario, an analyst must ask: Is this delay due to customer credit terms (e.g., Net-60) or poor collection efforts? If the contract explicitly allows payment at quarter-end, the cash gap is a structural feature of the business model, not an operational failure. However, if the client pays late without justification, it indicates a risk in customer quality or relationship management.
Diagnostic Exercise: Analyzing a Contrasting Scenario
To solidify this understanding, let us apply the same logic to a contrasting hypothetical case, “RetailFlow,” which operates on a prepayment model. Unlike TechStart, RetailFlow collects cash immediately upon sale but pays suppliers after 30 days. Assume RetailFlow generates $10,000 in revenue each month, with cost of goods sold (COGS) of $6,000 paid in Month 2. Salaries are $2,000 paid monthly.
- Month 1: Revenue Recognized: $10,000. Cash Received: $10,000. Cash Paid: $2,000 (Salaries). COGS Payable: $6,000 (Not yet paid). Net Income: +$2,000. Cash Balance Change: +$8,000.
- Month 2: Revenue Recognized: $10,000. Cash Received: $10,000. Cash Paid: $2,000 (Salaries) + $6,000 (Supplier Payment for M1). Net Income: +$2,000. Cash Balance Change: +$2,000.
RetailFlow shows consistent positive cash flow despite identical profit margins to TechStart’s quarterly average. The difference lies in the timing of cash movements relative to expense recognition. For TechStart, cash outflows preceded inflows. For RetailFlow, inflows preceded outflows. This contrast highlights why relying solely on the Income Statement is dangerous. An FBLA student analyzing these two companies must conclude that RetailFlow has stronger short-term liquidity resilience, while TechStart requires external financing or stricter credit controls to survive its growth phase.
Actionable Practice Task: Building the Bridge
How do you prepare for such questions in competition? Practice constructing a “Cash Flow Bridge” for any given scenario. Start with Beginning Cash. Add Operating Cash Flow (Net Income adjusted for non-cash items like depreciation and changes in working capital). Subtract Investing Cash Flows (CapEx). Subtract Financing Cash Flows (Dividends/Debt Repayment). Arrive at Ending Cash.
For TechStart, the bridge would show a significant negative adjustment for Accounts Receivable increase in Months 1 and 2, offset by a large positive adjustment in Month 3. Your task is to write a three-sentence executive summary for TechStart’s board. It must include: 1) The cause of the cash dip (timing mismatch), 2) The solution implemented (bridge funding), and 3) The long-term implication (need for tighter collection terms or faster billing cycles). Avoid vague statements like “cash flow was bad.” Instead, specify: “The $10,000 monthly cash burn in Q1 resulted from a 90-day collection cycle against immediate payroll obligations, necessitating $5,000 of hypothetical short-term bridge funding to maintain operations until the Month 3 collection event.”
This level of specificity distinguishes high-scoring analyses from basic ones. Judges reward students who can link accounting mechanics to strategic recommendations. By practicing this bridge construction and narrative synthesis, you move beyond memorizing definitions to demonstrating true financial literacy, a core competency tested in FBLA Business Plan and Financial Analysis events.
Frequently Asked Questions
Can a business be profitable and still fail?
Yes. A business can report accounting profit while experiencing a liquidity shortage. If a company has high profits on paper but slow customer payments and high immediate expenses, it can run out of cash to pay bills. This is a liquidity crisis, not necessarily legal insolvency or bankruptcy.
Why is cash flow more important than profit for startups?
Startups often operate with limited capital reserves. Since they cannot pay bills with ‘profit’ (an accounting number), they need actual cash. Negative cash flow halts operations faster than negative profit. However, growth does not always consume cash first—prepayment models can generate cash before costs are incurred.
How do I calculate operating cash flow using the indirect method?
In a simplified indirect-method reconciliation, start with net income, reverse relevant noncash items, and adjust for changes in operating working capital such as receivables, inventory and payables. Do not treat the change in cash itself or new borrowings as operating working-capital adjustments. Borrowing is financing cash flow; purchases of long-term assets are generally investing cash flow.