For students preparing for FBLA competitive events that involve market research, business planning, or chapter initiatives, a frequent stumbling block is not knowing what to ask, but knowing how to ask it so the answers are usable. A survey in a business context is not merely a collection of opinions; it is an instrument for generating evidence. The difference between a high-scoring project and a mediocre one often lies in the rigor of the survey design.
The Core Difficulty: From Opinion to Evidence
The primary challenge in FBLA Survey Design is converting raw subjective feedback into objective business insights. Many students assume that if they ask enough people a question, the answer is automatically valid. This is incorrect. Validity depends on structure, neutrality, and alignment with the specific business problem being solved. If your survey questions are leading, ambiguous, or disconnected from your final recommendations, the data you collect will be unusable, regardless of sample size.
Teaching Illustration 1: The Leading Question Trap
Consider a student analyzing a local coffee shop’s potential to introduce a subscription model. They distribute a survey with this question:
- Question: “How much do you love the idea of saving money by subscribing to our new coffee plan?”
- Response Scale: 1 (Not at all) to 5 (Love it)
Analysis: This question contains two flaws. First, it assumes the user knows the plan saves money (leading). Second, it uses emotionally charged language (“love”) which invites social desirability bias rather than honest behavioral intent. The resulting data might show high enthusiasm, but when the student tries to calculate projected revenue, the numbers don’t match reality because the respondents were signaling politeness, not purchase intent.
Teaching Illustration 2: The Shortcut That Fails
A student in a hurry decides to skip pilot testing and uses a question borrowed from an online template: “How satisfied are you with our service?” with options from “Very Dissatisfied” to “Very Satisfied.” The survey gets 200 responses, 85% selecting “Satisfied” or higher. The student concludes the business should expand.
Where the shortcut fails: The question measures generic satisfaction, not behavioral intent. The student never asked whether respondents would pay a higher price, visit more frequently, or recommend to others. The “high” satisfaction score provided false confidence because it was disconnected from any business decision. Judges see decorative data that doesn’t support the recommendation.
Teaching Illustration 3: The Neutral Behavioral Question
A better approach focuses on behavior and trade-offs. For the same coffee shop scenario:
- Question: “If a monthly subscription offered a 15% discount on all drinks, how many cups per week would you expect to buy?”
- Response Options: 0, 1-2, 3-5, 6+
Analysis: This question removes emotional bias. It forces the respondent to consider a specific price point (15%) and their actual consumption habits. The data collected can be directly used to model customer lifetime value. If most respondents choose “0,” the student has evidence that the current discount level is insufficient, guiding a concrete recommendation to increase the discount or bundle items.
Diagnostic Table: Common Survey Flaws
To ensure your survey yields usable evidence, check your questions against these common pitfalls. This diagnostic framework helps identify where your data might fail during the judging process.
| Flaw Type | Description | Impact on Evidence | Correction Strategy |
|---|---|---|---|
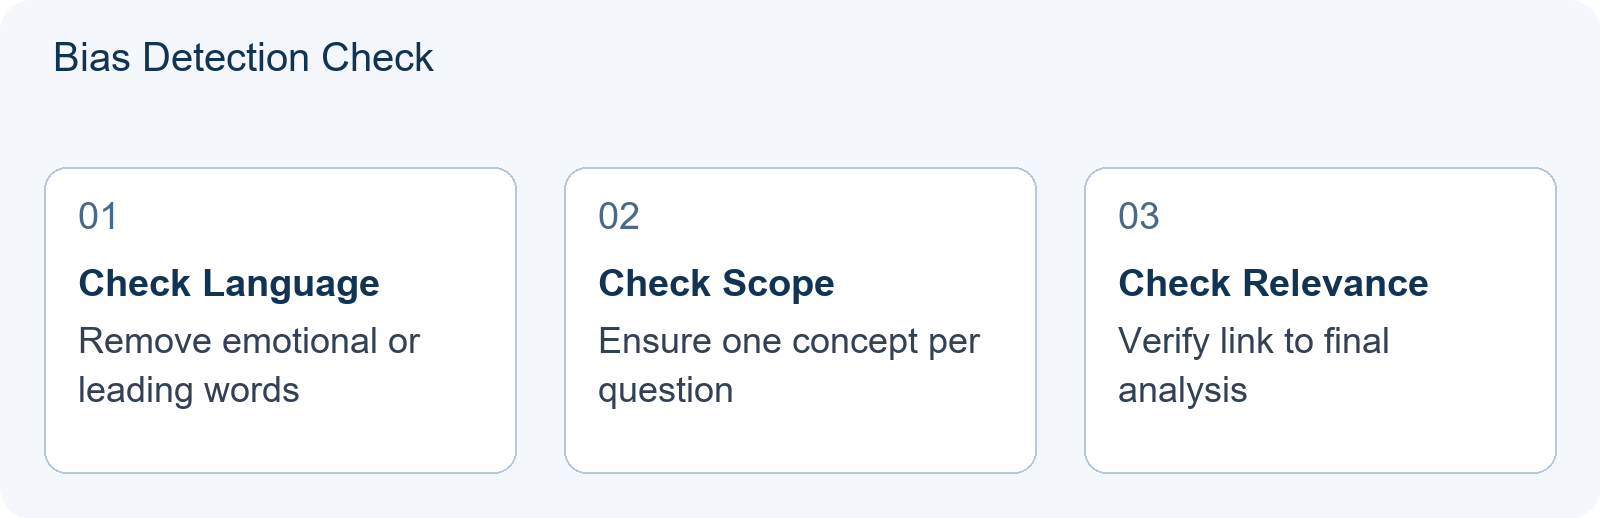
| Leading Language | Questions that suggest a ‘correct’ or desirable answer. | Inflates positive sentiment; masks true barriers. | Use neutral verbs (e.g., ‘rate’ instead of ‘love’). |
| Double-Barreled | Asking about two things in one question (e.g., ‘Was the service fast and friendly?’). | Ambiguous data; cannot isolate variables. | Split into two separate questions. |
| Vague Metrics | Using terms like ‘often,’ ‘soon,’ or ‘good’ without definition. | Inconsistent interpretation across respondents. | Define timeframes or scales explicitly. |
| Disconnected Analysis | Survey questions unrelated to the final business recommendation. | Data feels decorative, not evidentiary. | Map every question to a specific hypothesis. |
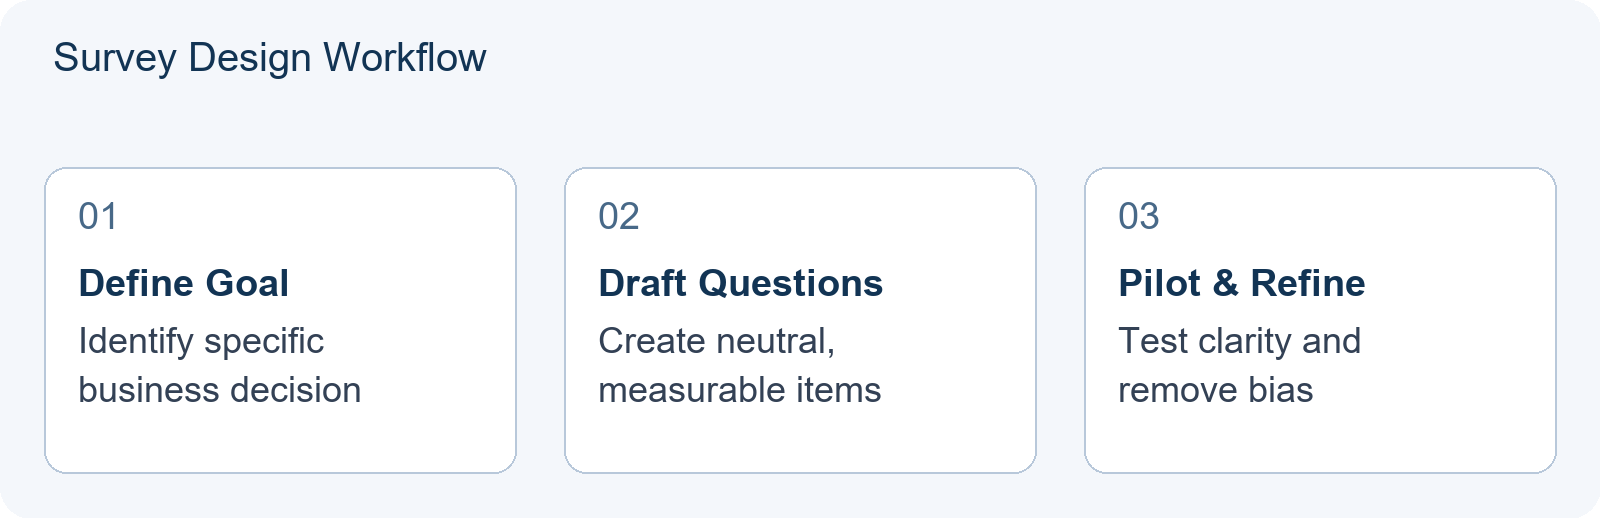
Targeted Practice Sequence
Improving survey design requires iterative practice. Follow this sequence to build robust instruments for your next project:
- Define the Business Problem: Before writing a single question, state clearly what decision the survey will support (e.g., pricing change, product launch).
- Draft Hypotheses: List 3-5 assumptions you want to test (e.g., ‘Customers prefer convenience over price’).
- Write Questions for Each Hypothesis: Ensure every question maps directly to one hypothesis. Remove any question that doesn’t serve this purpose.
- Pilot Test: Run the survey with 5-10 peers. Ask them to explain why they chose each answer. Look for confusion or misinterpretation.
- Refine Scales: Ensure response options are mutually exclusive and collectively exhaustive.
Linking to Broader Preparation
While survey design is a specific skill, it operates within the broader context of FBLA competitive events. Understanding how judges evaluate data integrity is crucial for events that require primary research or market analysis. For foundational business terminology that strengthens your survey instrument, see The FBLA Business-Term Command Test: 60 Terms You Must Use, Not Just Recognise (2026-27). For the full landscape of technology-oriented events where survey data might feature, review FBLA Digital Technology Events (2026-27): The 14-Event Tech Cluster Inside a Business Competition. If you are deciding which competitions to layer alongside your FBLA preparation, consult Which Business Competitions to Stack With FBLA — and Which to Skip (2026-27).
Conclusion: The Demonstrable Skill
The specific skill a learner should demonstrate after mastering this topic is the ability to justify every survey question by linking it to a business decision. In your competition materials, include a brief methodology section that explains why certain questions were asked and how the responses will be analyzed. This transparency turns opinions into credible business evidence, distinguishing your project from those that rely on superficial data collection. The practice decision is simple: before finalizing any survey, delete every question that does not directly test a stated hypothesis—and be prepared to explain that deletion to a judge.
Frequently Asked Questions
How many questions should an FBLA survey have?
There is no fixed number, but brevity improves completion rates. Focus on 5-10 core questions that directly address your business hypotheses. Longer surveys risk respondent fatigue and lower-quality data.
Can I use open-ended questions in my survey?
Yes, but limit them to 1-2 questions. Open-ended responses are difficult to quantify and analyze quickly. Use closed-ended questions for statistical evidence and save open-ended ones for qualitative insights.
What if my survey results contradict my initial assumption?
This is valuable evidence. Do not discard the data. Analyze why the contradiction occurred and adjust your business recommendation accordingly. Judges reward honest analysis over forced conclusions.