For students preparing for Future Business Leaders of America (FBLA) competitions, particularly in Marketing or Finance events, FBLA Break-Even Analysis is a targeted quantitative skill. Unlike broad business concept reviews, this calculation requires precise handling of cost structures and revenue assumptions. Many competitors struggle not with memorizing the formula, but with identifying which costs are truly fixed versus variable, and how to adjust when contribution margins change at different volume levels.
The Core Difficulty: Beyond the Formula
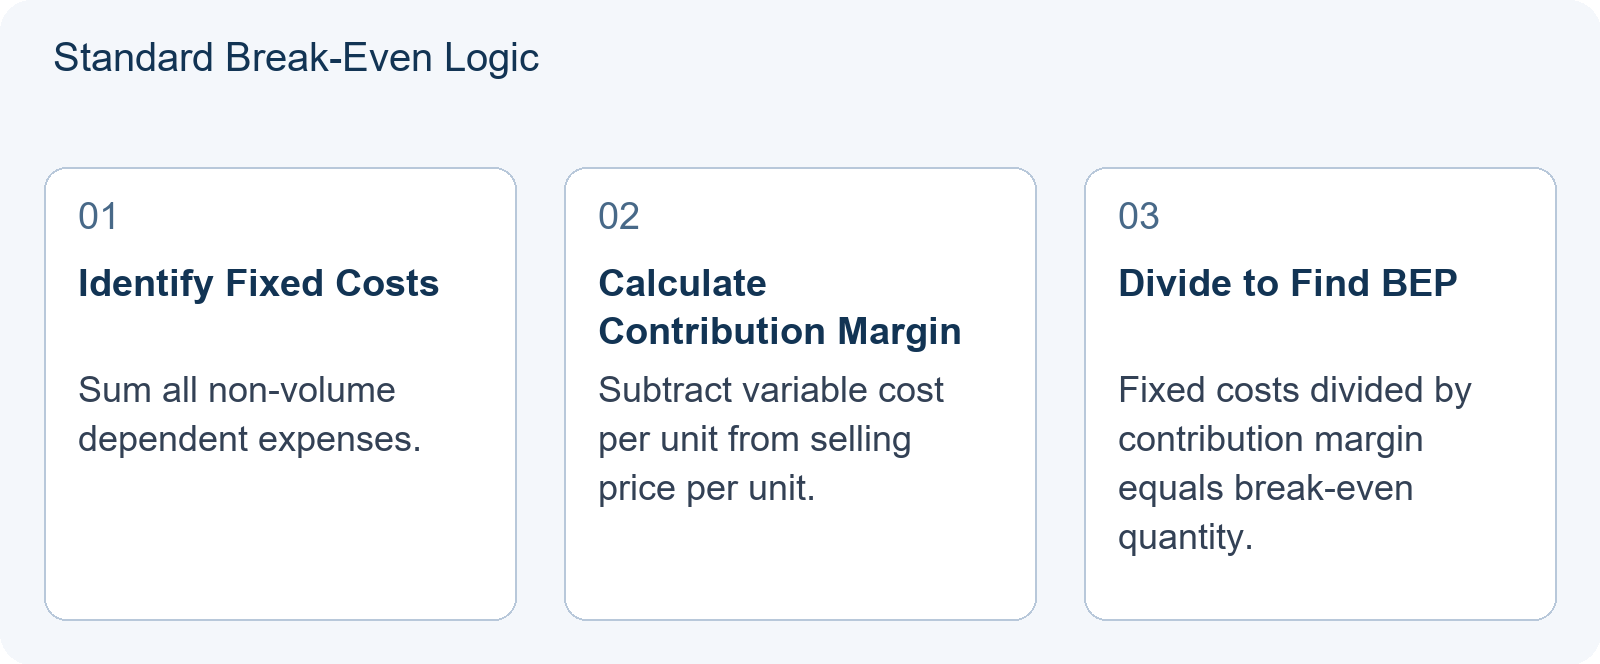
The basic break-even point (BEP) formula is straightforward: BEP (units) = Fixed Costs ÷ (Price per Unit − Variable Cost per Unit). However, in FBLA case studies, the challenge lies in data extraction and assumption validation. Students often misclassify semi-variable costs or fail to account for changes in contribution margin when pricing strategies shift. This article focuses on these specific reasoning failures through two contrasting teaching illustrations.
Note: The following scenarios are original teaching illustrations created for instructional purposes. They are not official FBLA contest problems, past competition questions, or derived from official scoring guidance.
Teaching Illustration 1: The Standard Scenario
Imagine a student chapter selling custom-branded water bottles at a school event. The organizers provide the following data:
- Fixed Costs: $500 for booth rental and design setup.
- Variable Cost: $3 per bottle for materials and printing.
- Selling Price: $8 per bottle.
First, calculate the contribution margin per unit: 3 = $5. Then divide total fixed costs by this margin: 5 = 100 units.
In this standard scenario, the logic holds because price and variable costs remain constant regardless of volume. A student who correctly identifies the $500 as purely fixed and the $3 as purely variable will arrive at the correct answer. This demonstrates the baseline competency expected in objective tests.
Teaching Illustration 2: The Tiered Pricing Trap
Now consider a more complex scenario with tiered pricing. A startup plans to sell eco-friendly notebooks with this cost and price structure:
- Fixed Costs: $2,000 for inventory storage and initial marketing.
- Variable Cost: $4 per notebook.
- Pricing Strategy: $10 per notebook for the first 200 units; $7 per notebook for all units beyond 200.
- Demand Estimate: Market research suggests sales could reach 500 units.
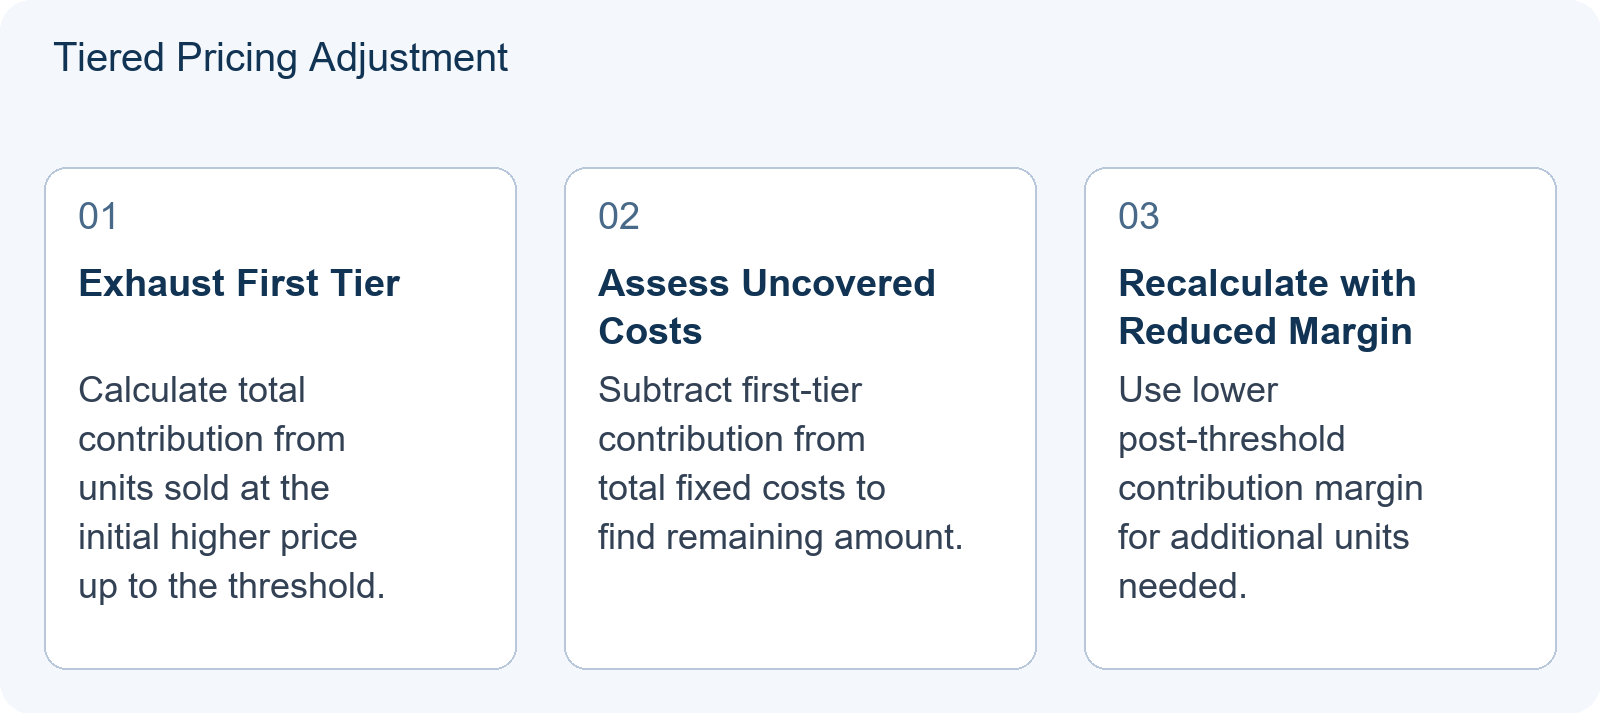
Applying the single-price formula using only the initial $10 price yields: 10 − $4) = 333.33 units, rounded up to 334 units. However, this result exceeds the 200-unit threshold where the price drops. Because the calculated break-even point falls in a different pricing tier than assumed, the single-margin approach produces an incorrect answer.
Correct step-by-step approach:
- Calculate profit from first tier:
200 units × (4) = $1,200. - Determine remaining fixed costs:
1,200 = $800. - Calculate new contribution margin after discount:
4 = $3. - Find additional units needed:
3 = 266.67, rounded up to 267 units. - Total break-even quantity:
200 + 267 = 467 units.
The single-price approach underestimates the true break-even point by 133 units—a 28% error that could lead to flawed business decisions. This illustration shows that FBLA Break-Even Analysis often requires multi-step logic where the contribution margin is not static.
Diagnostic Table: Common Reasoning Failures
| Error Type | Description | Correction Strategy |
|---|---|---|
| Misclassifying Costs | Treating semi-variable costs (e.g., utilities with base fee) as entirely fixed or variable. | Separate the base component (fixed) from the usage component (variable). |
| Static Margin Assumption | Applying one contribution margin across all volumes despite tiered pricing or bulk discounts. | Calculate cumulative profit until thresholds are crossed, then recalculate remaining needs with the new margin. |
| Ignoring Demand Constraints | Calculating a theoretical BEP that exceeds maximum possible market capacity. | Compare BEP against estimated demand; if BEP exceeds pessimistic demand estimates, the venture is unviable. |
Targeted Practice Sequence
To prepare for these nuances, follow this sequence:
- Identify Cost Behavior: List every cost item and categorize it strictly as Fixed, Variable, or Mixed.
- Map Revenue Structure: Note any changes in price per unit based on volume tiers.
- Calculate Segment Margins: Determine contribution margin for each price segment.
- Iterative Break-Even: Start with the highest margin segment. If fixed costs are not covered, move to the next segment with remaining uncovered costs.
- Validate Against Demand: Compare your calculated BEP to your demand estimate. If BEP > pessimistic demand, the plan is financially unviable regardless of theoretical margin.
For broader context on selecting relevant events, refer to our guide on Choosing FBLA Events by Intended Major: Finance, CS, Marketing and Economics Pathways (2026-27). Understanding whether your focus is on pure finance or marketing strategy helps tailor your preparation depth. Additionally, review FBLA 2026-27 Test Blueprints: Where the 100 Questions Come From in Every Objective Test, With a Study-Hour Allocator for general study habits, and consult What FBLA Really Costs from China: A 2026-2027 Budget and Timing Guide if you are working in a group setting where role division affects individual accountability.
Conclusion: Demonstrating Competency
The specific skill a learner should demonstrate next is the ability to articulate why a simple formula fails in complex scenarios. In oral presentations or written reports during FBLA events, judges value the explanation of assumptions over just the final number. Show your work clearly, state your assumptions about cost behavior and pricing tiers, and explicitly address any uncertainty in demand. This analytical rigor distinguishes competitors who understand business modeling from those who merely plug numbers into equations.
Frequently Asked Questions
What if I cannot determine if a cost is fixed or variable?
In competition cases, look for keywords like ‘per unit’ (variable) or ‘monthly/annual’ (fixed). If ambiguous, state your assumption clearly in your presentation and justify it logically. Judges typically reward transparent reasoning over hidden guesses.
Should I round break-even answers up or down?
Round up to the next whole unit. Since you cannot sell partial units, rounding down would leave costs partially uncovered. Always verify whether your calculated BEP falls within the pricing tier assumed for that calculation.
How does uncertain demand affect my break-even analysis?
Uncertainty does not change the mathematical BEP, but it changes the risk assessment. Compare your calculated BEP against pessimistic, expected, and optimistic demand estimates. If pessimistic demand falls below your BEP, the venture carries high risk of loss regardless of the theoretical calculation.